Transit Costs
Space, Time and Money on Bay Area Transit
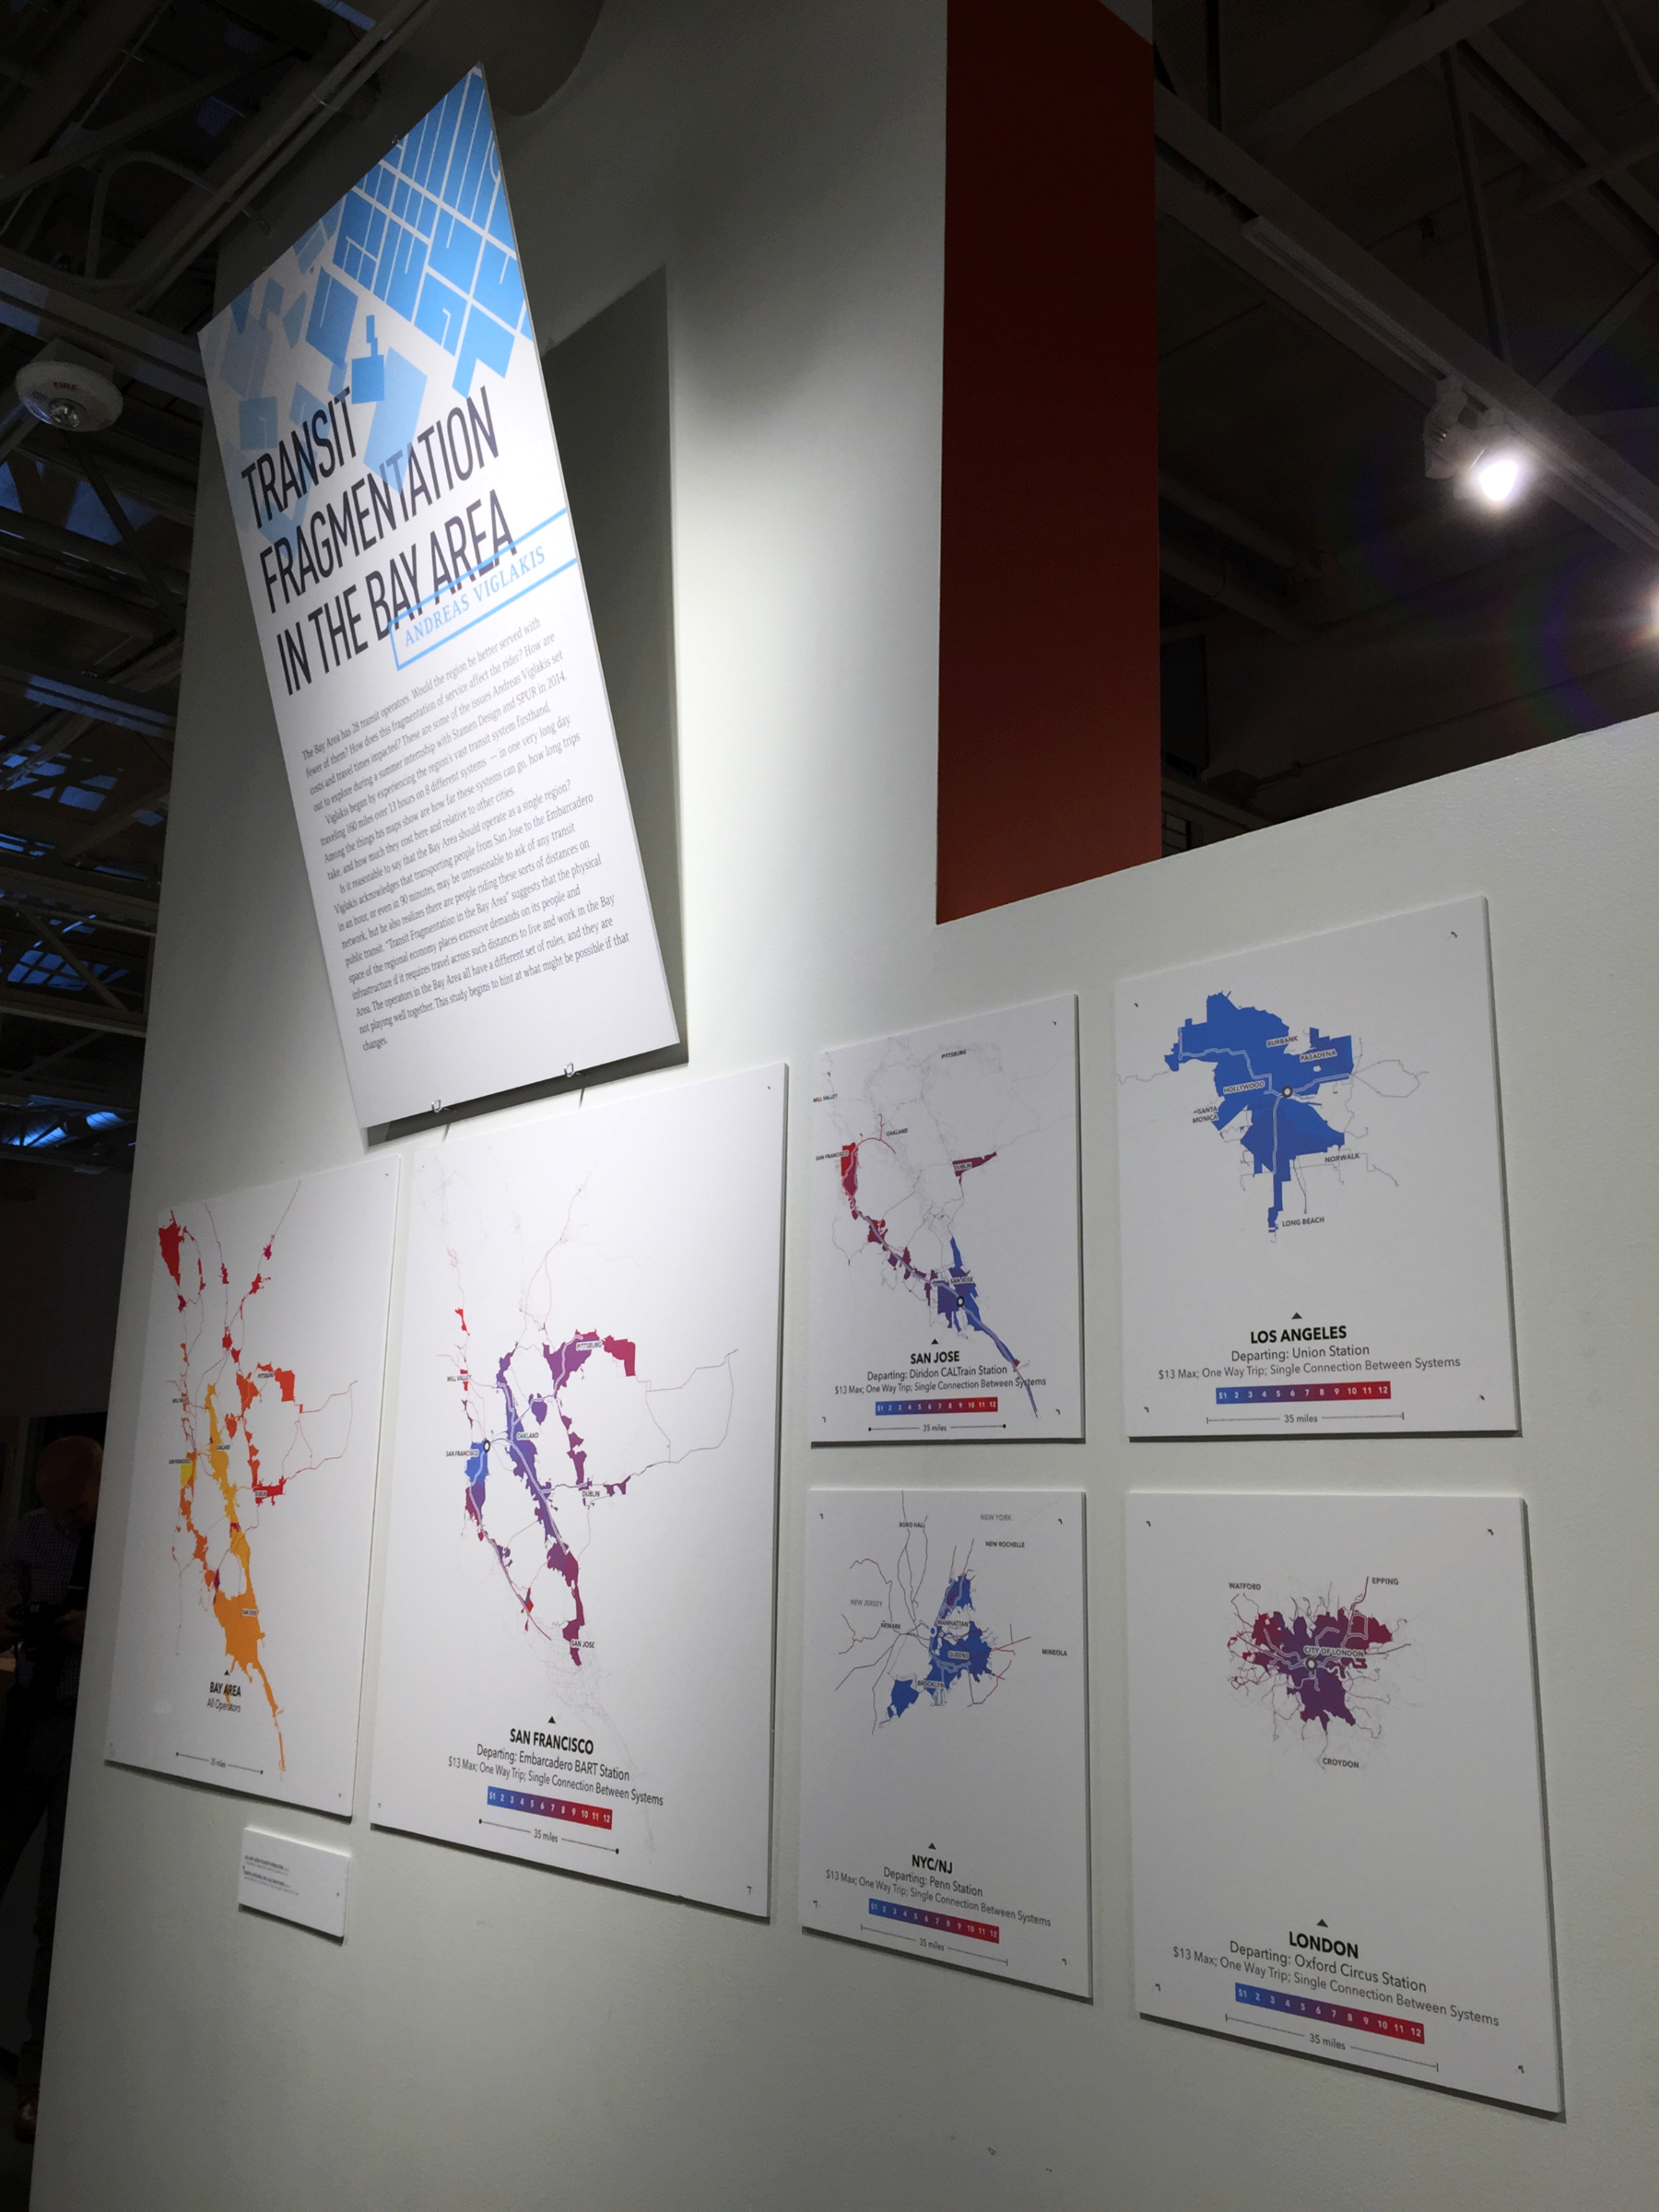
I was commissioned in the summer of 2014 to conduct a map and data visualization project focused on the Bay Area by Stamen, a San Francisco mapping and data visualization design office, and SPUR, a Bay Area urban policy think-tank. I looked at the region's public transportation network - undertaking studies on the transit system's cost, scale, and accessibility - and produced physical maps, interactive visualizations, and animations that approached at the Bay Area's transit infrastructure through the lenses of cost, time and geography. I was responsible for every stage of the project, from concept development to data collection and research to the delivery of the final design products.
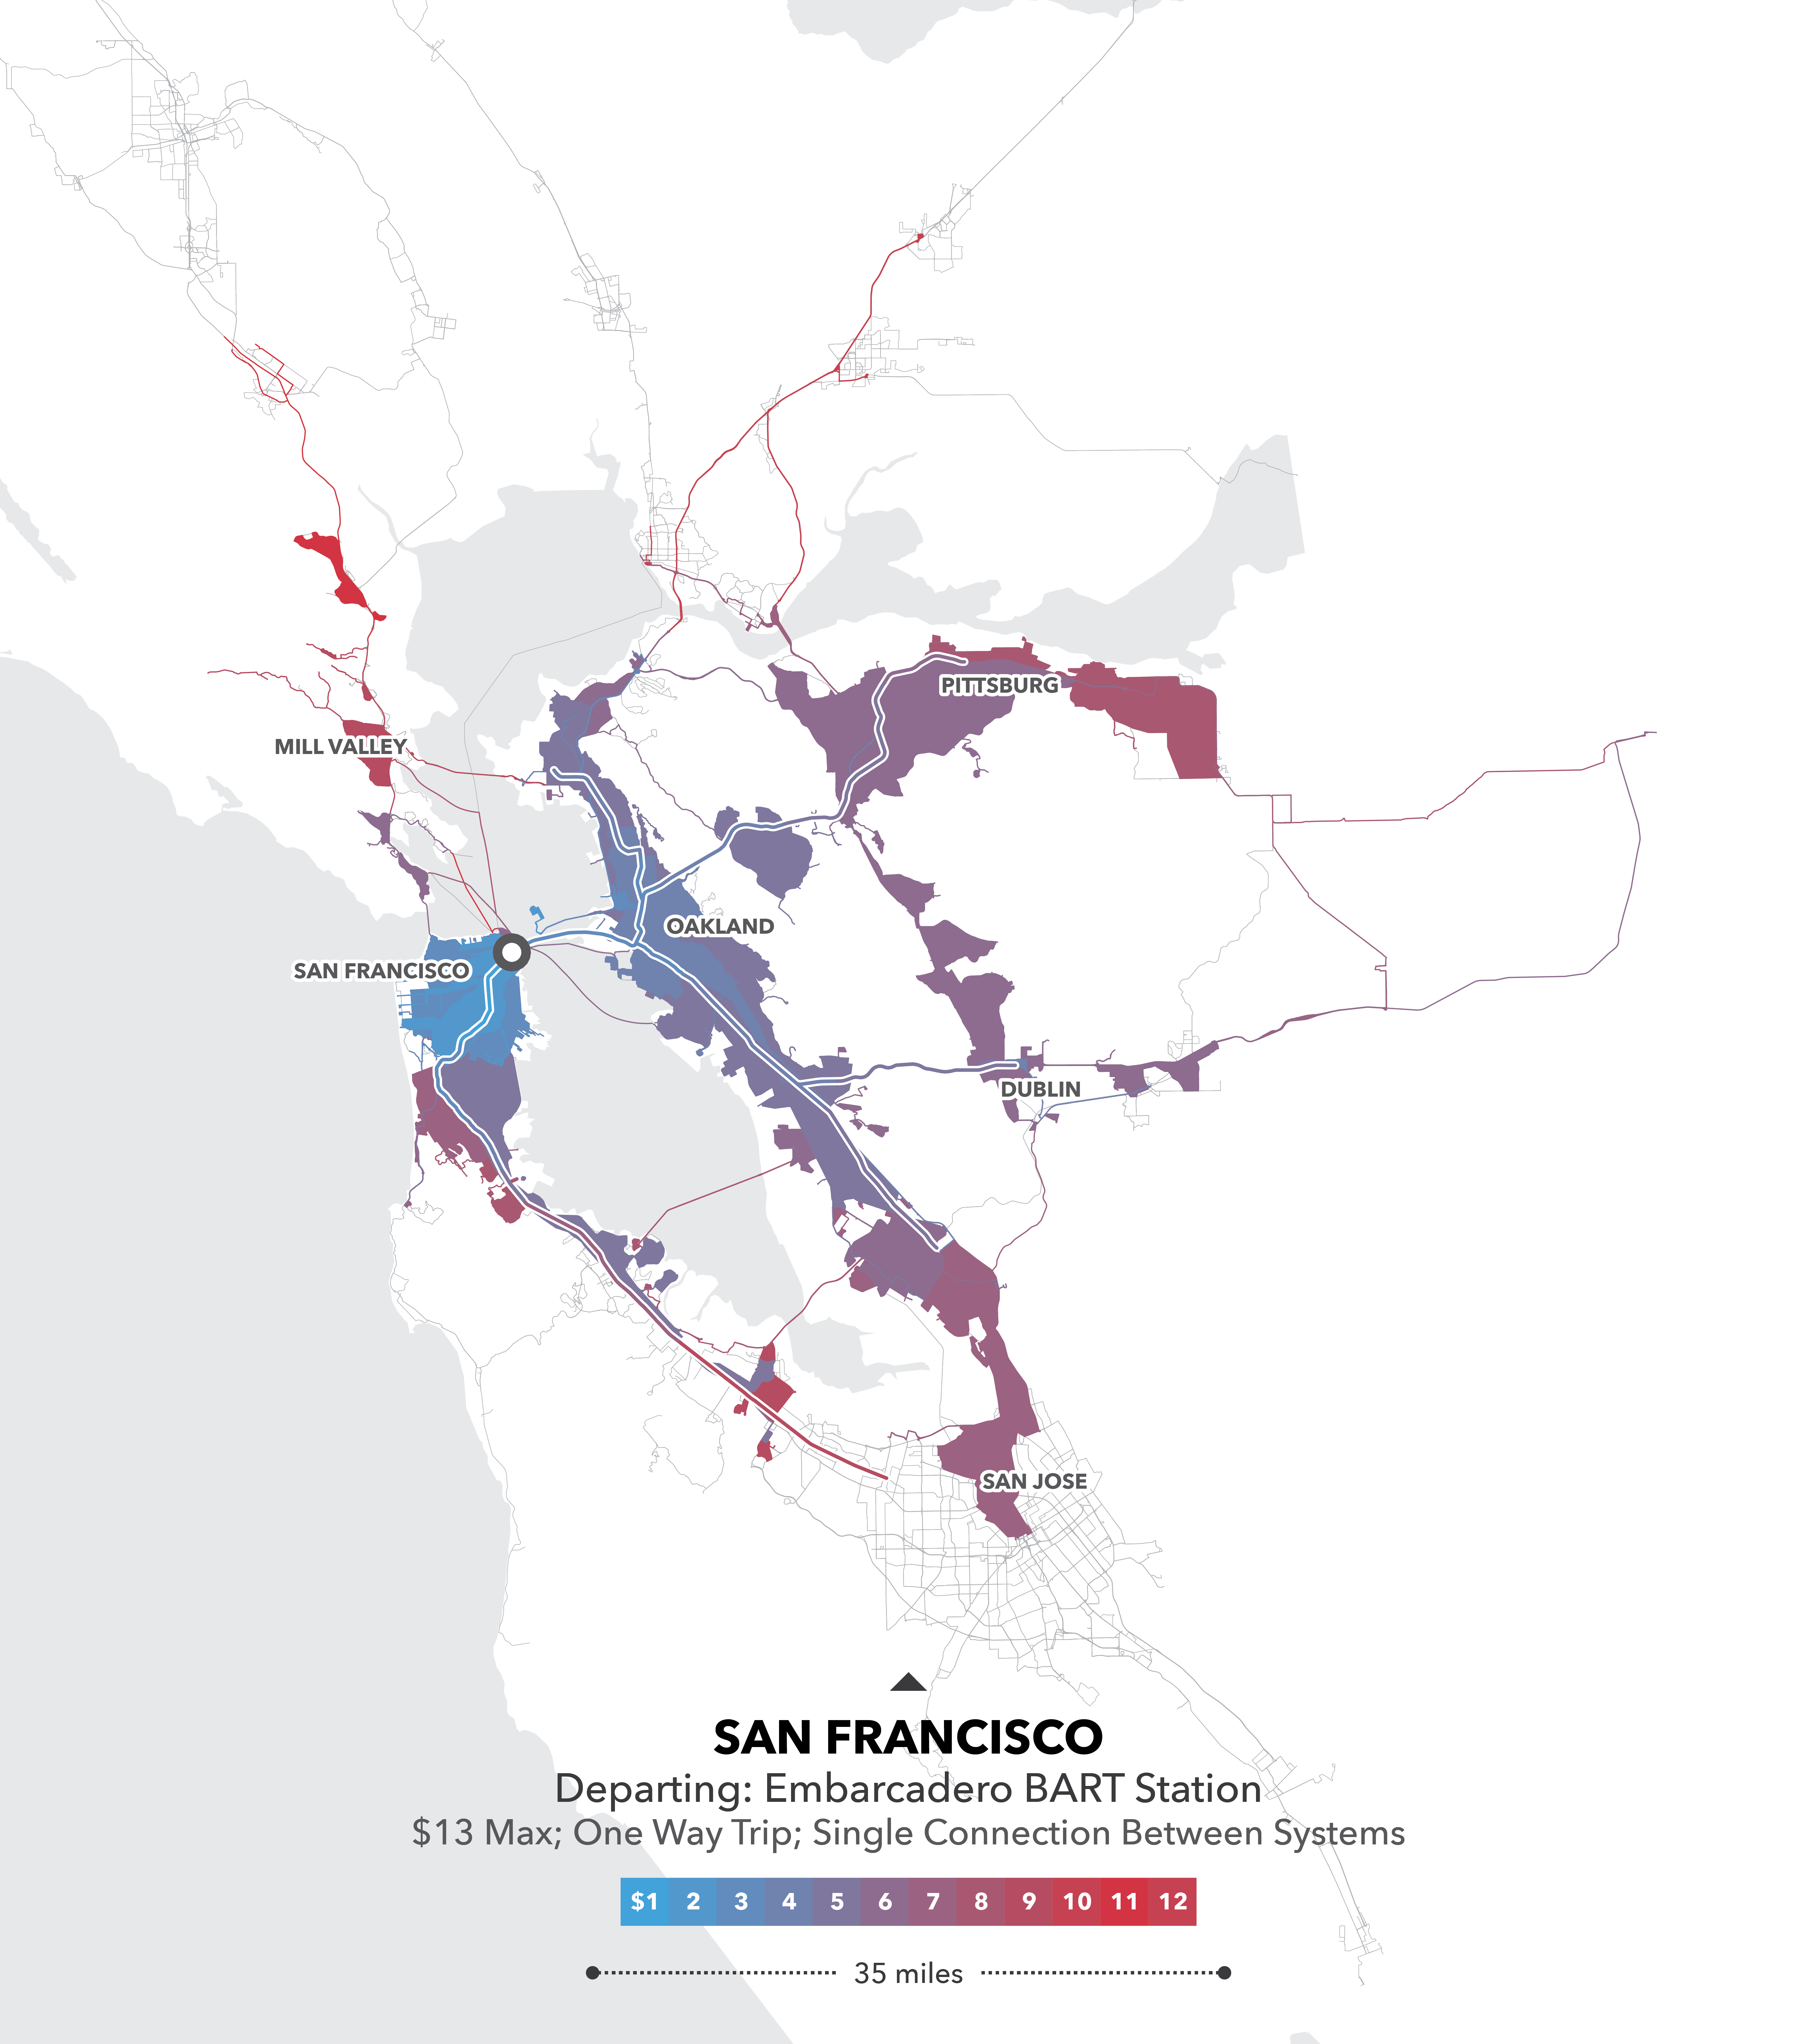
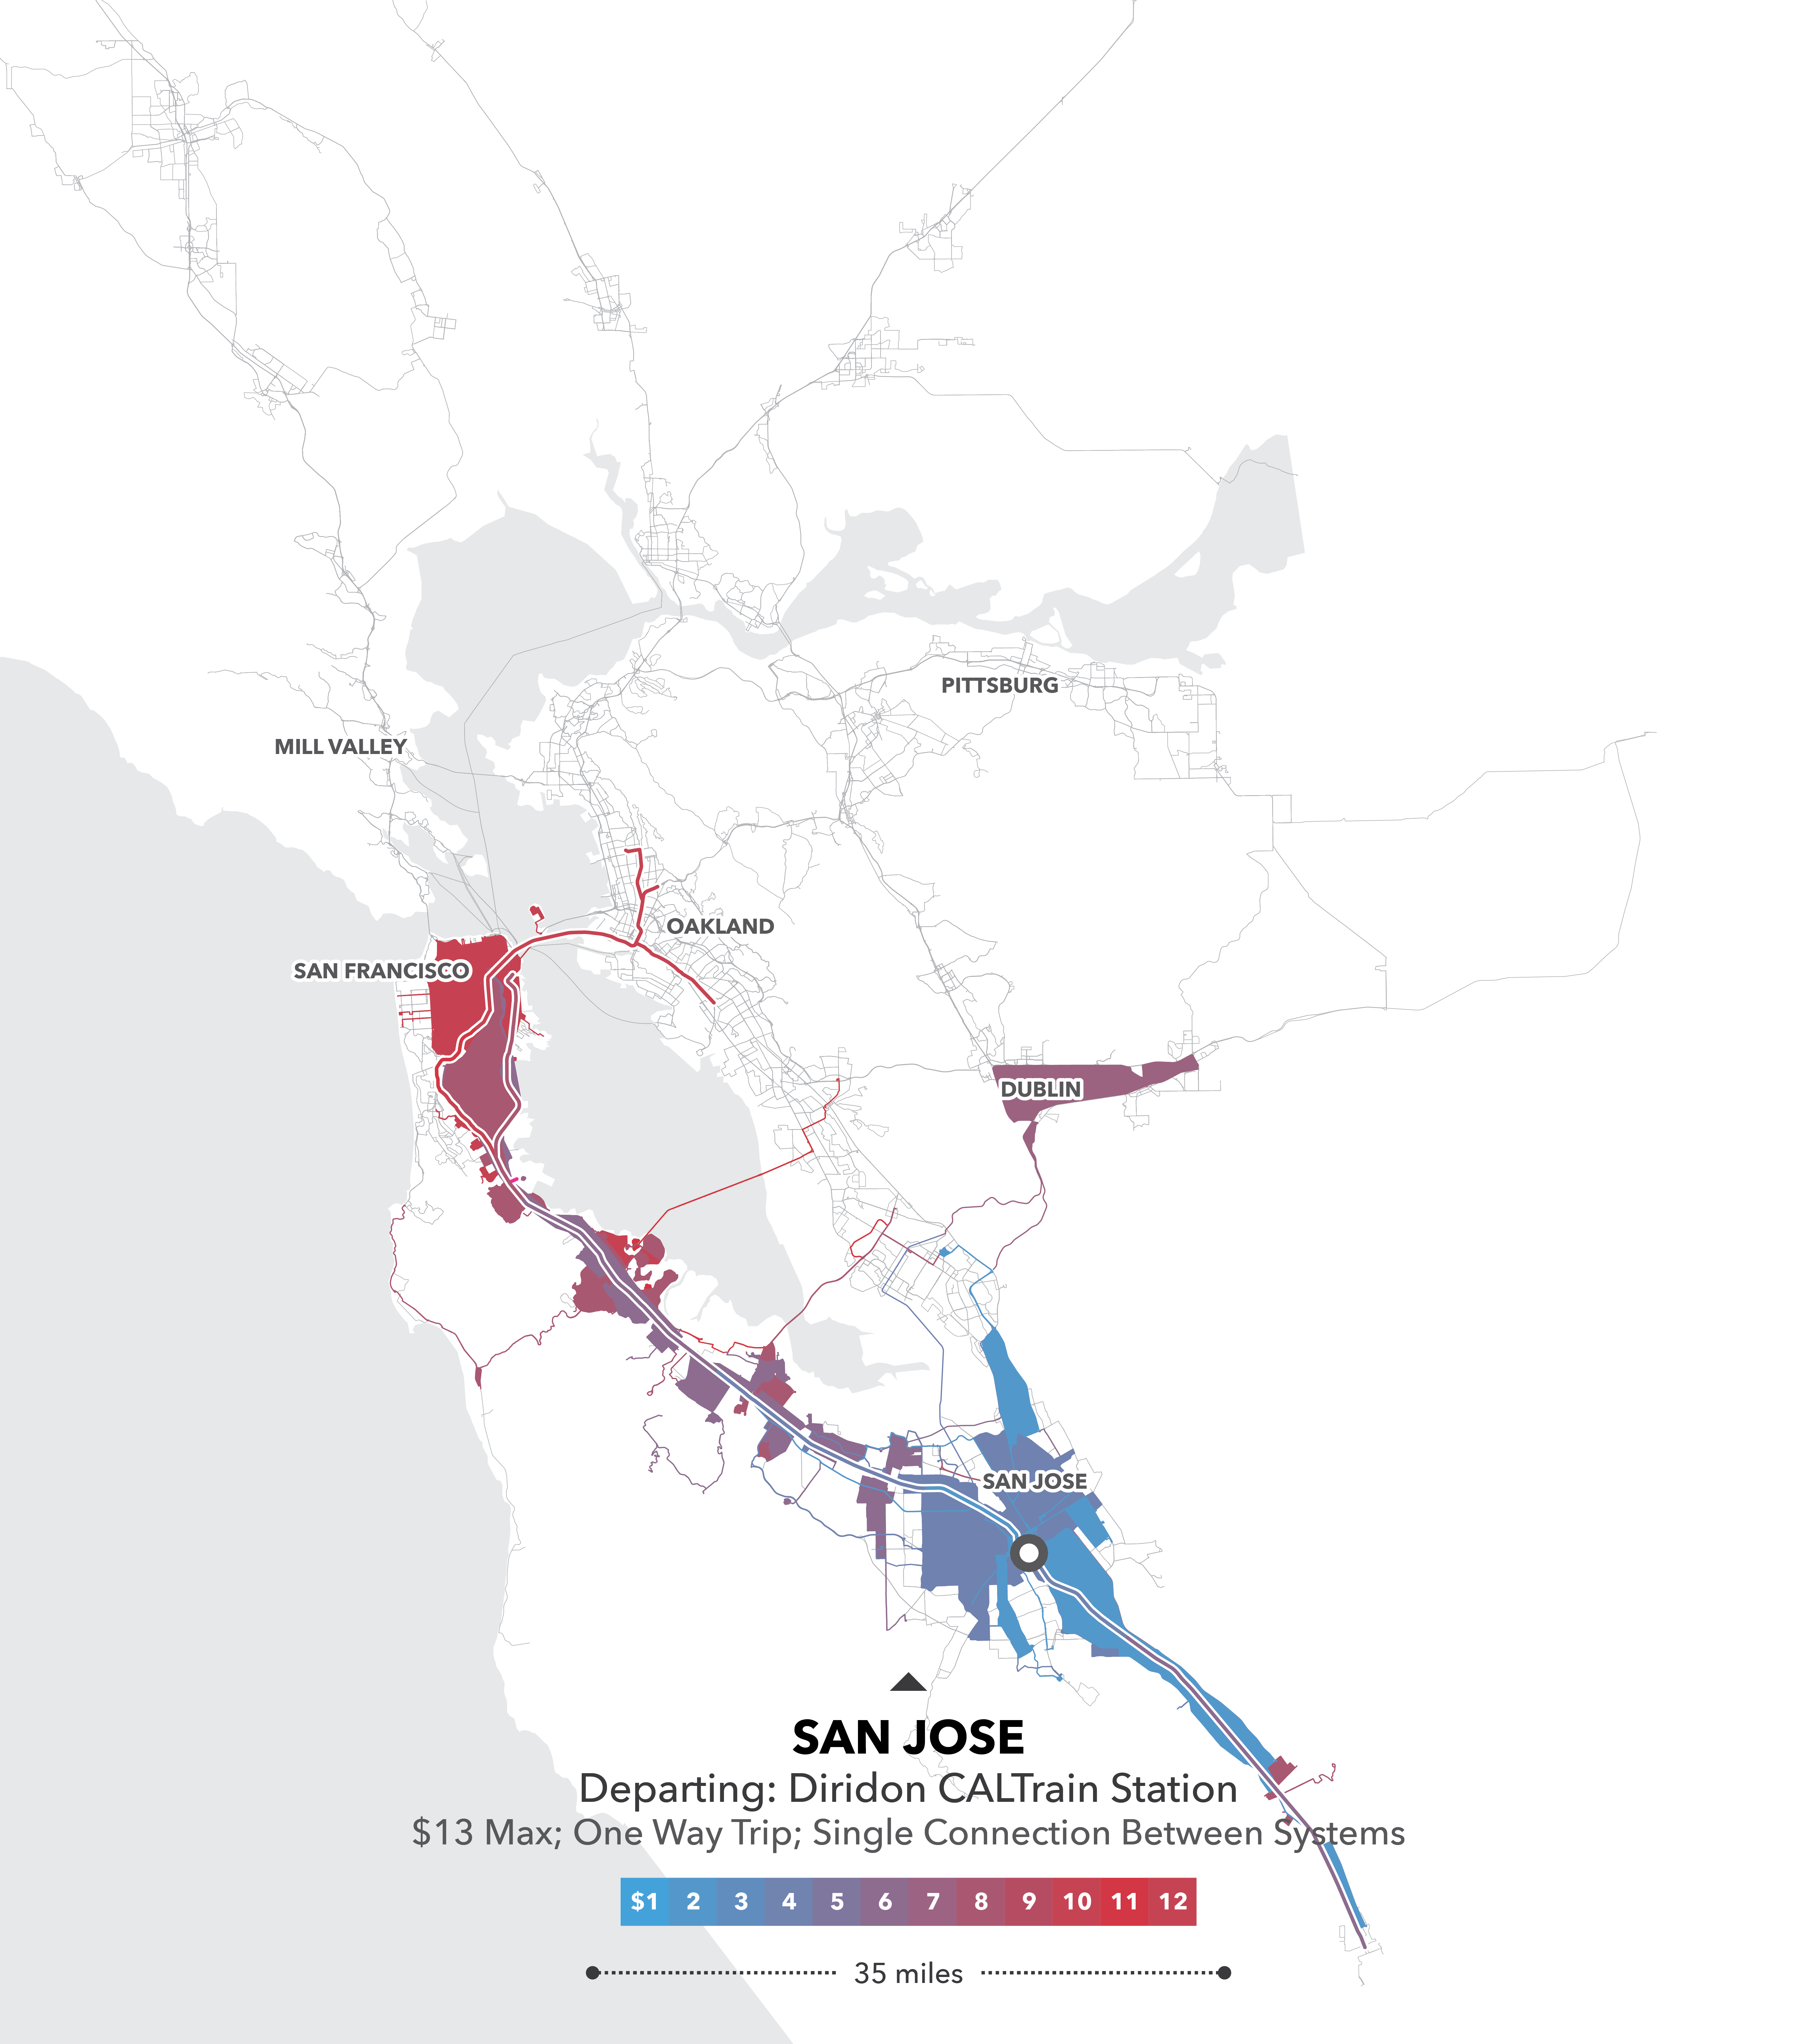
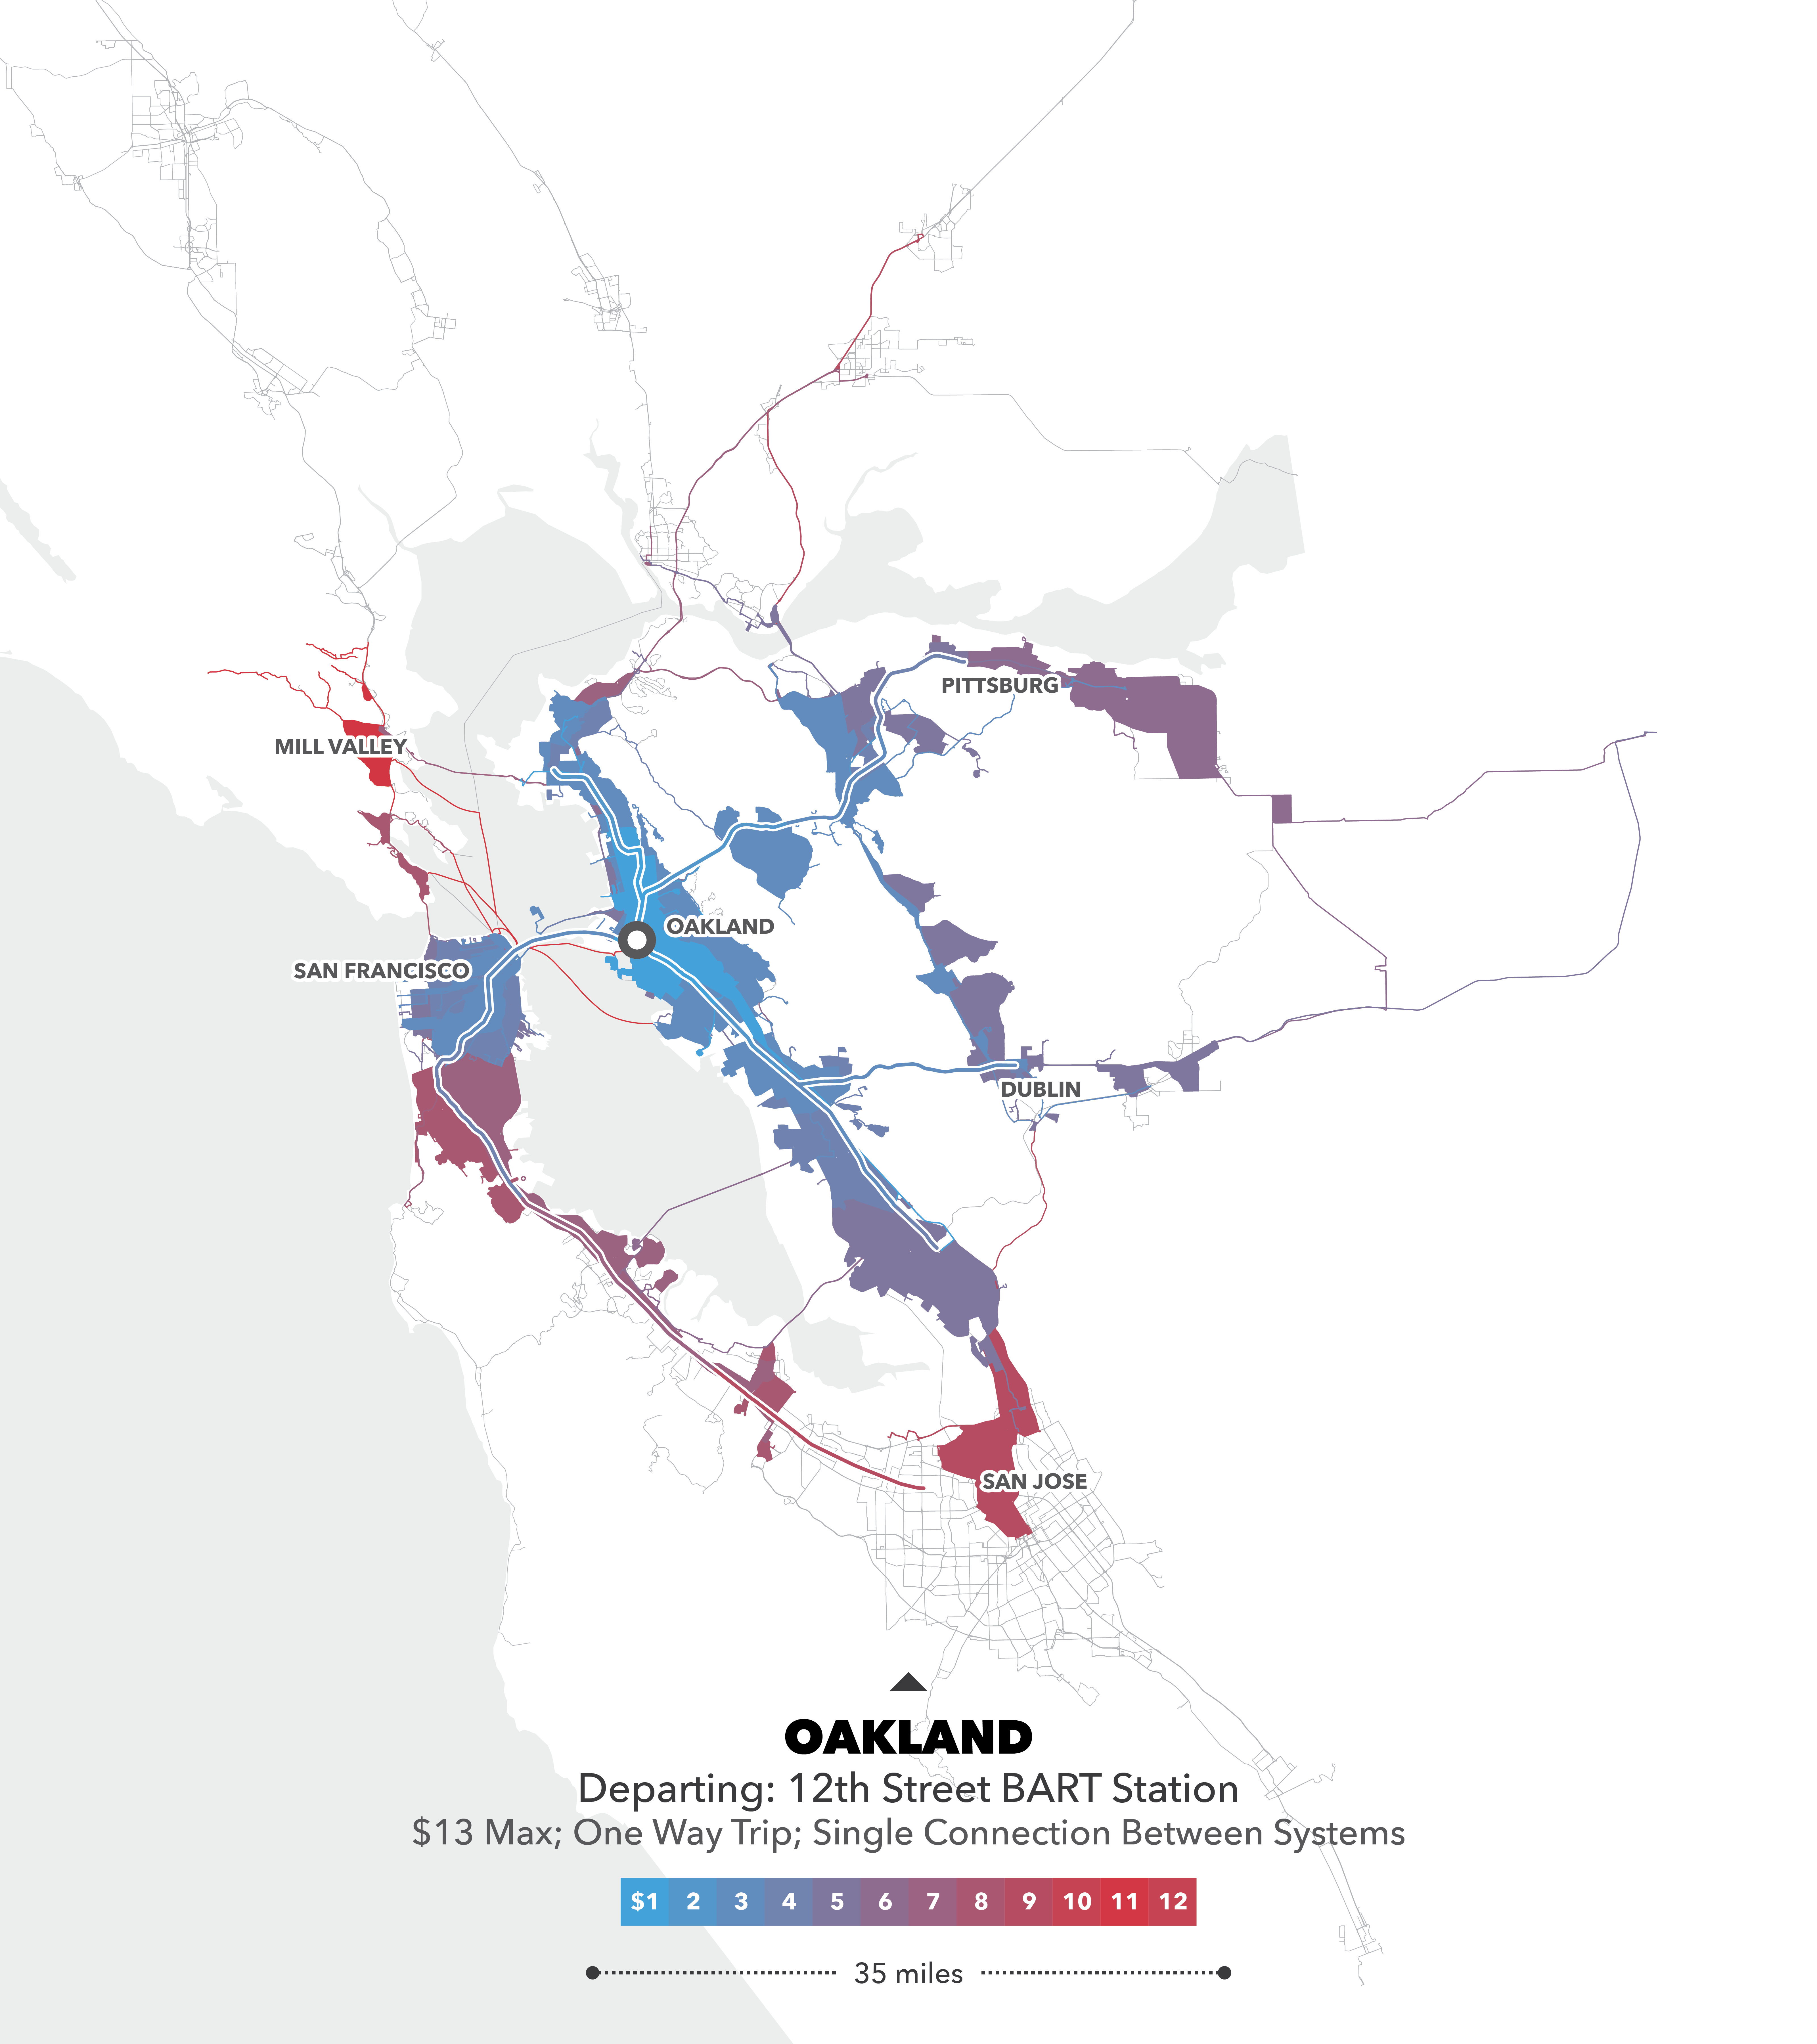
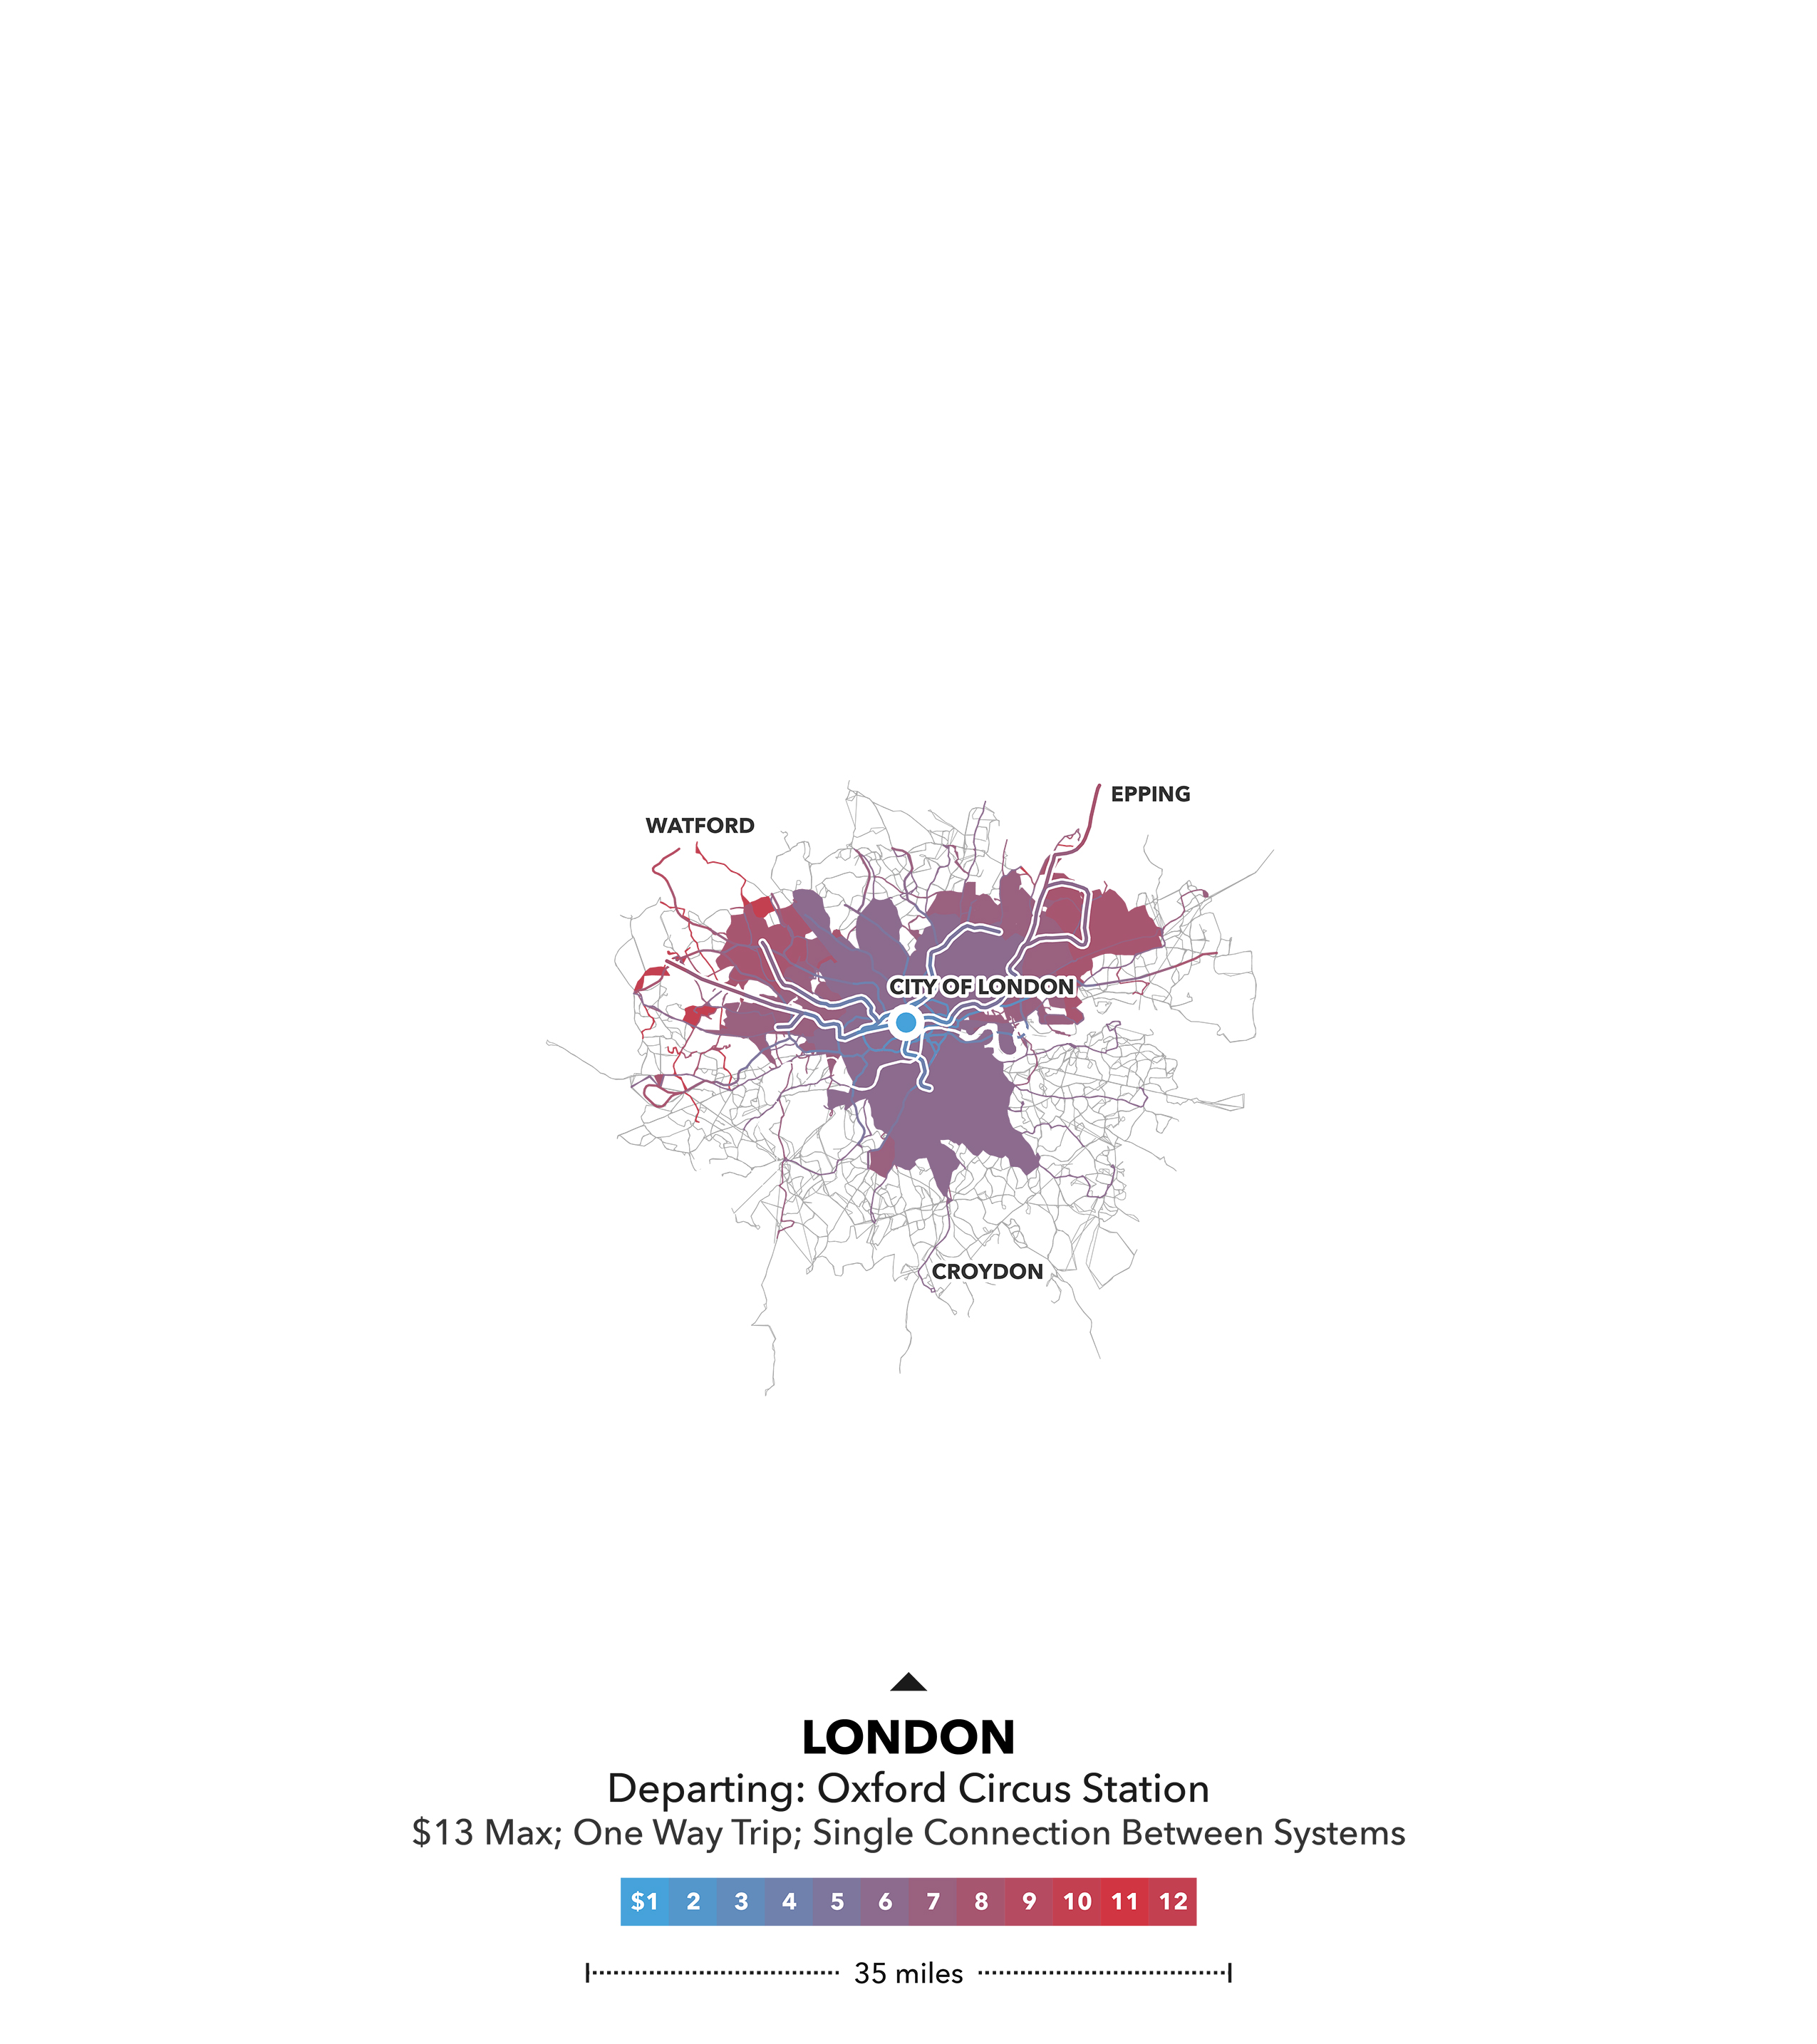
The below visualizations chart, relative to a series of starting points, how much it costs to travel around the Bay Area using the region's various transit systems. Each map overlays regional BART and Caltrain network geometries on top of bus transit lines and service areas, all colored according to cost along a blue-red spectrum. To help provide context and a sense of scale I also created visualizations for London, New York City, and Los Angeles.
This project was exhibited in the fall of 2014 as a part of SPUR's "Urban Cartography" exhibition and subsequently published both in their monthly journal and a variety of online publications.
This project was exhibited in the fall of 2014 as a part of SPUR's "Urban Cartography" exhibition and subsequently published both in their monthly journal and a variety of online publications.
Journeys starting in San Francisco
Journeys starting in San Jose
Journeys starting in Oakland
Journeys starting in London
"Urban Cartography" exhibition