Border Control
Dynamic State, Aquifer, and Watershed Maps
Most people do not have a completely clear understanding of the hydrological systems they live within. I thought a tool that uses maps to visualize these areas could help people to start to learn about and consider their place within these regions. This project asks the user the supply a location and then, depending on their selection, displays a map of either the state, aquifer or watershed boundary for the given city.
.
This project touches a lot of different parts of the Mapbox stack: geocoding, to make the maps reflect a specific place; the Surface API, to query data stored in the tiles; and GL-based maps, which offer dynamic visual control and whose rendering helps dramatize the shifts between state, watershed and aquifer boundaries. See the project on Github here, and click here to open the project.
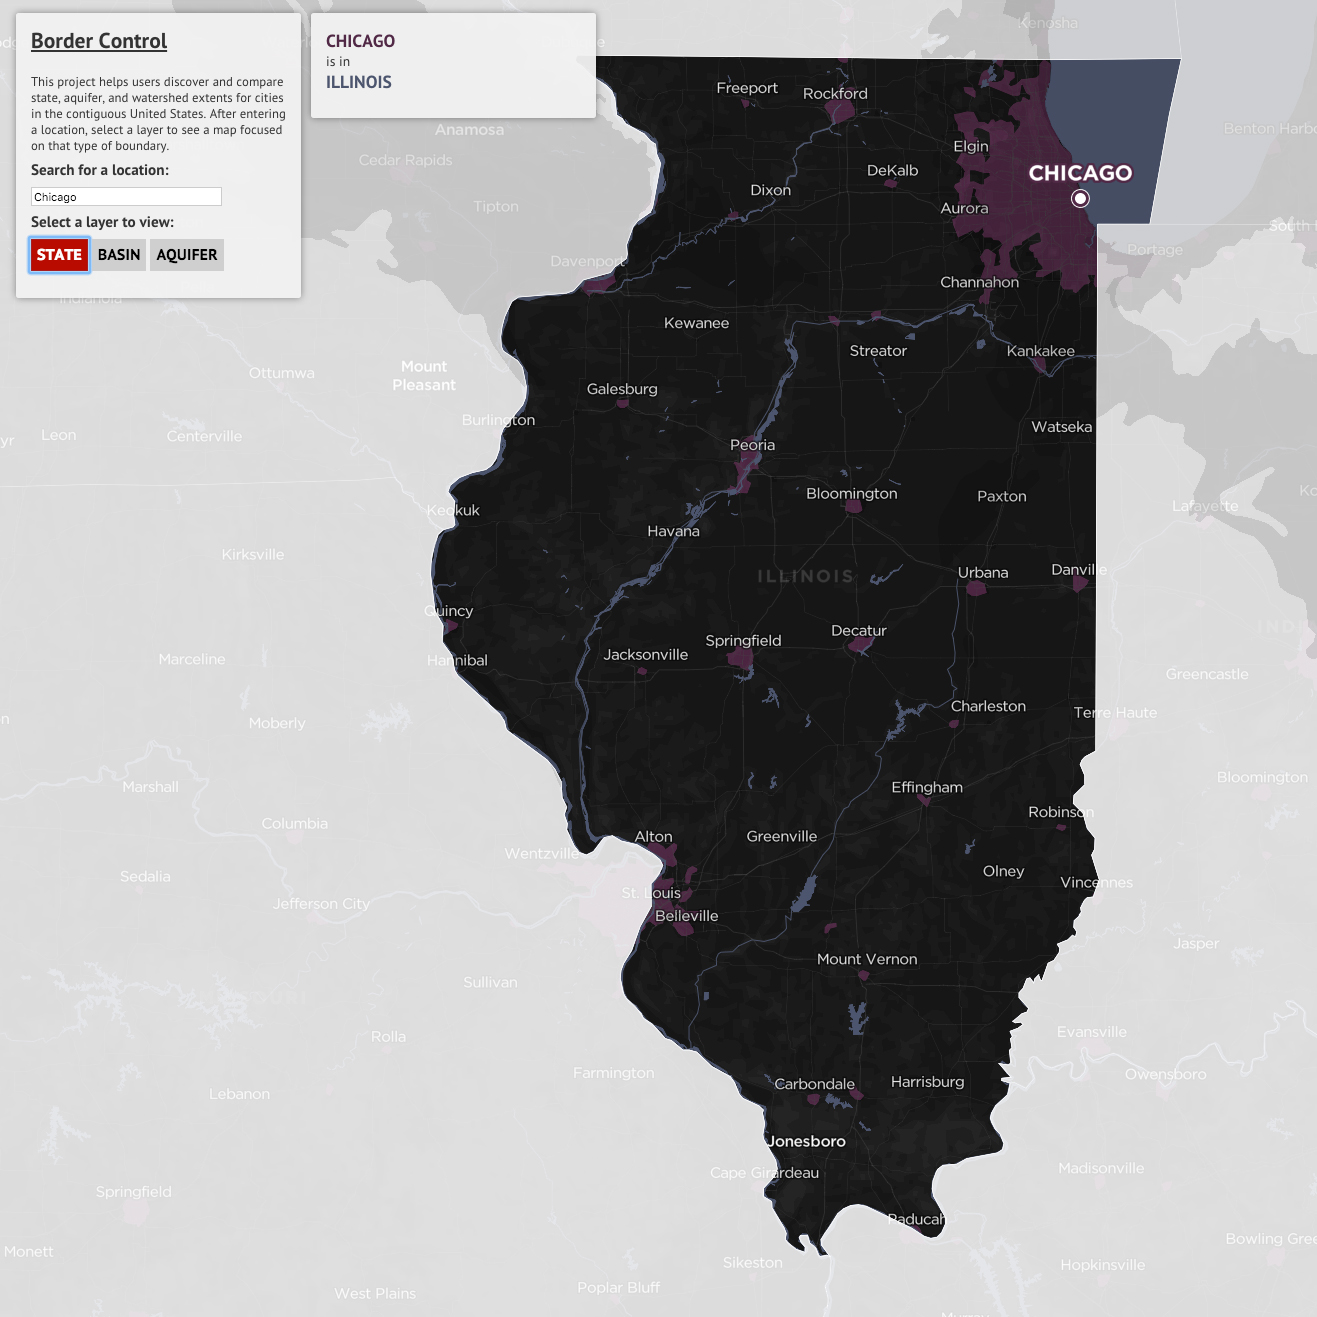
Chicago - State Layer
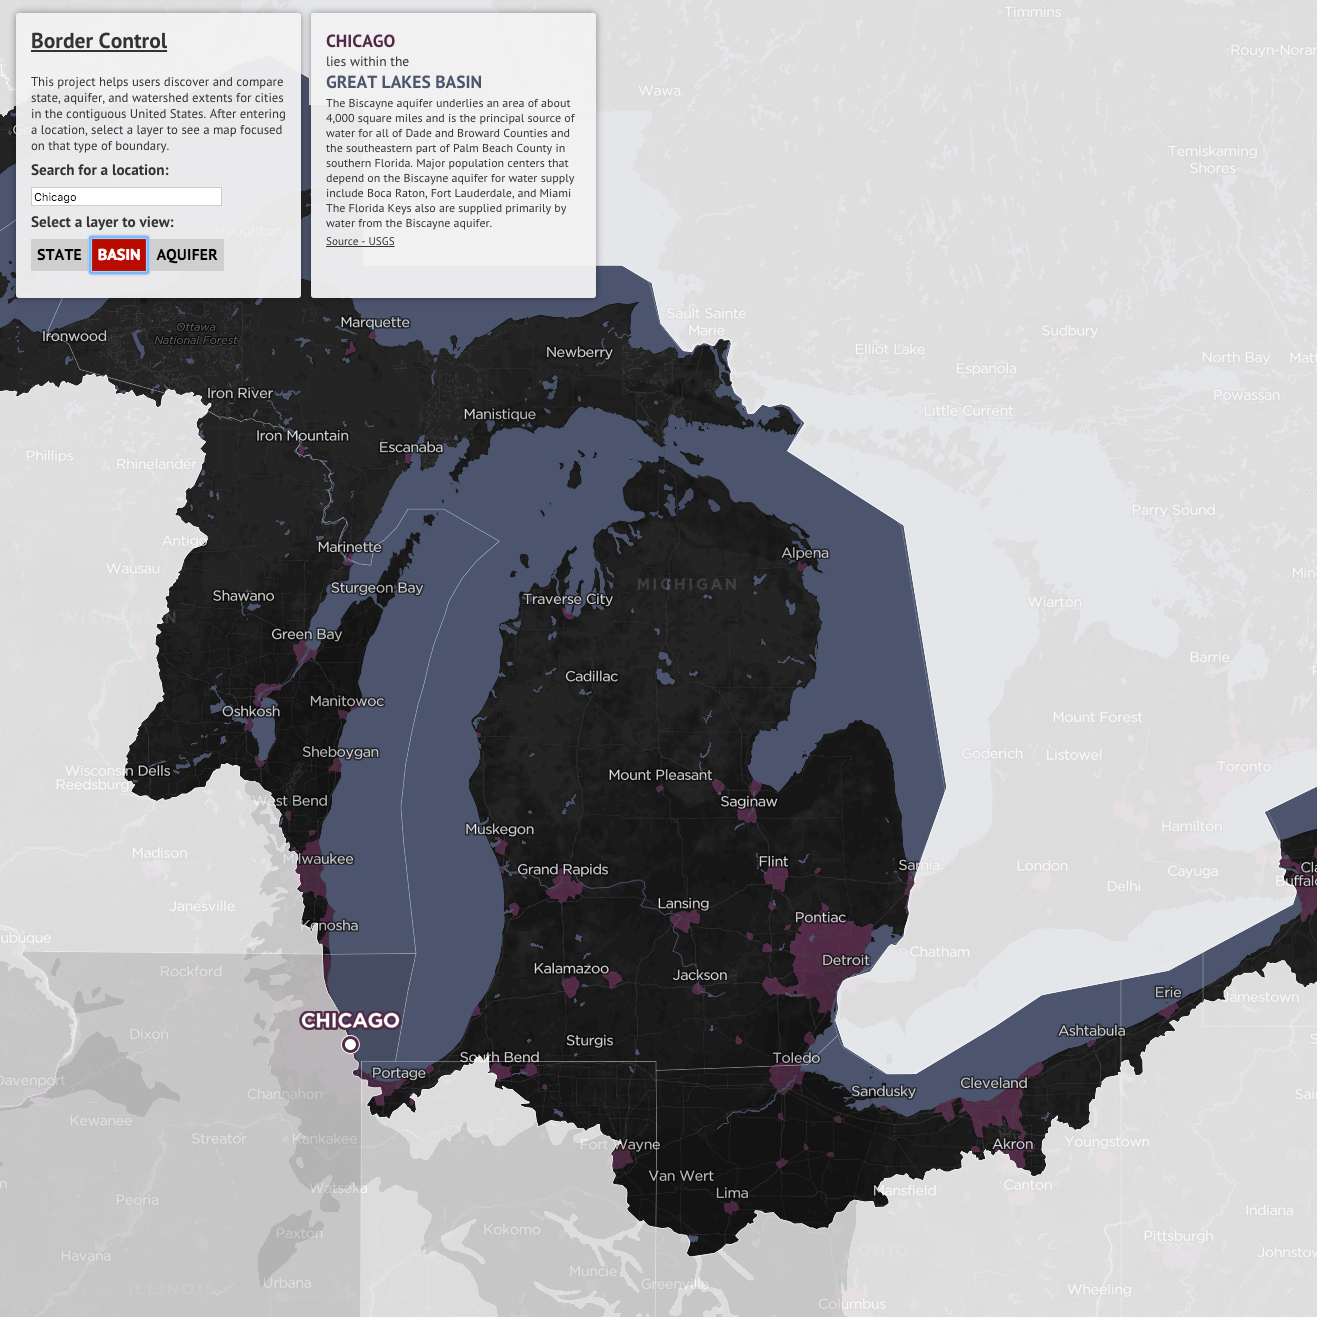
Chicago - Watershed Layer
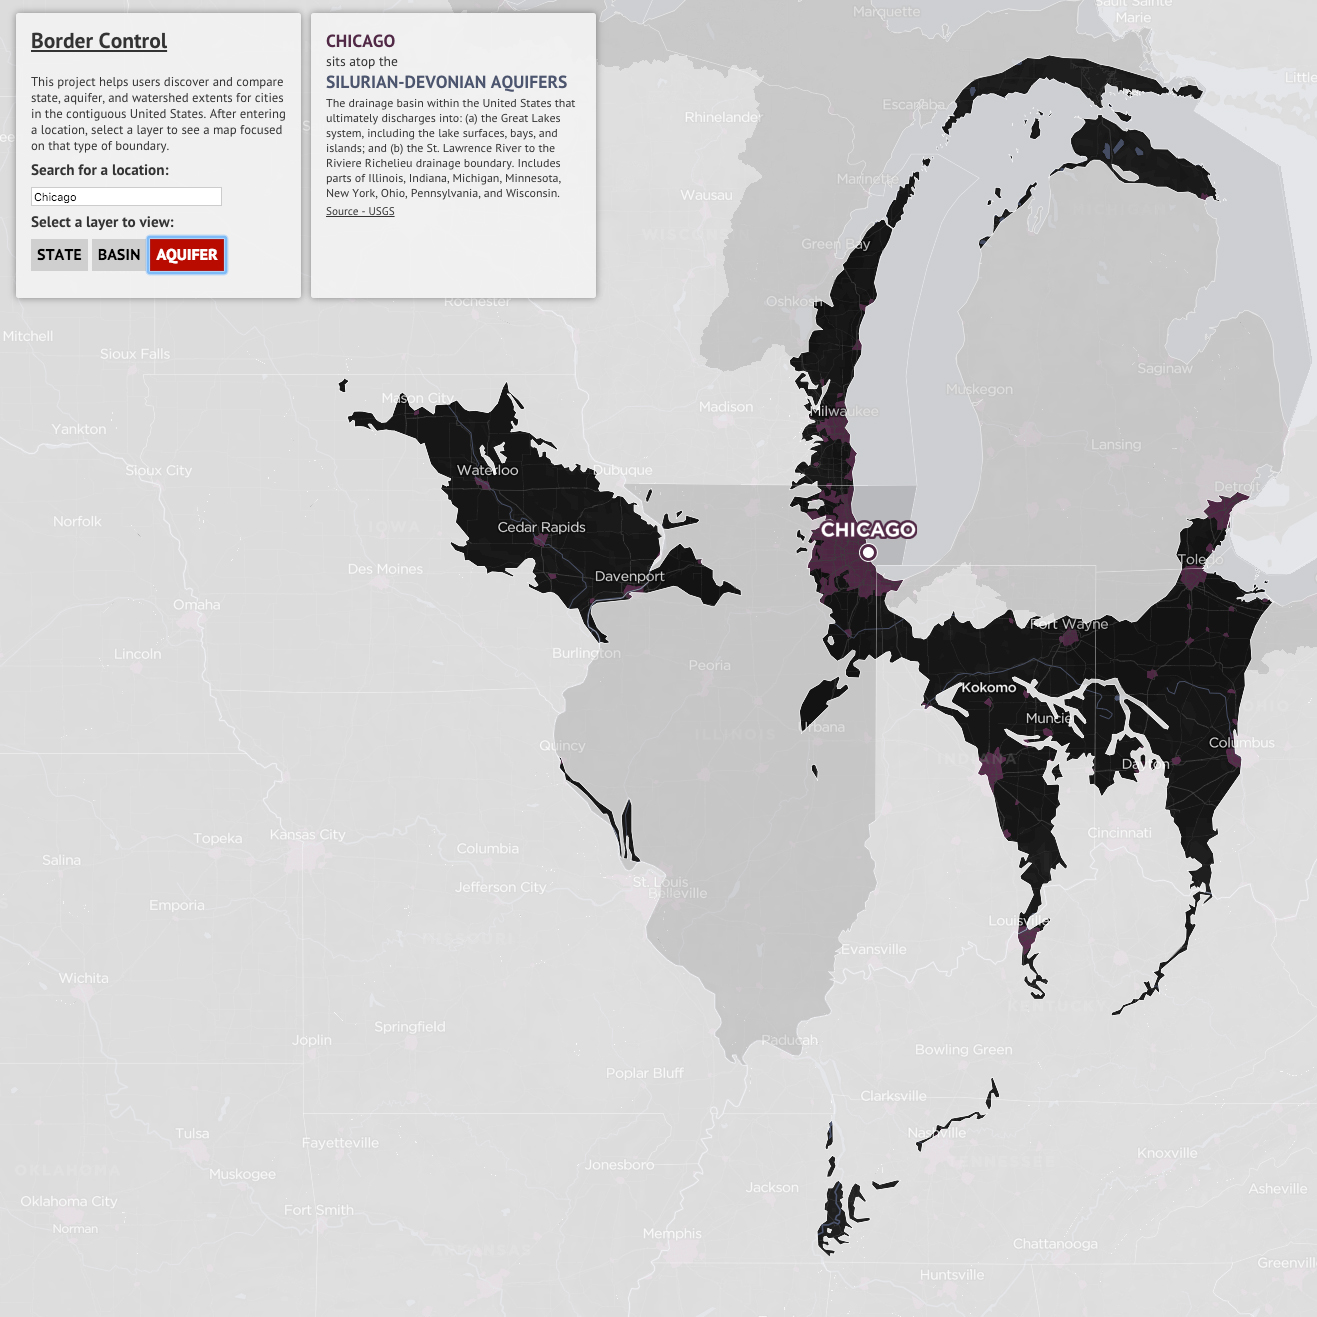
Chicago - Aquifer Layer